Open Source Analytics In A Beautiful Dashboard? - Part 2
Picking up where we left off in the last post, we’re going to do some housekeeping. Namely, I’m going to frame this in the context of a docker container and ditch the virtual environment… If you don’t care about dockerizing this application, that’s fine, just skip ahead a bit. This will make the postgres addition a cake walk in the future, and remove the dependencies of having python on your machine… but adding a docker requirement instead (can’t win all your battles). So Let’s add a few files to the root level, namely the docker files.
|-- Dockerfile
|-- README.md
|-- docker-compose.override.yml
|-- docker-compose.prod.yml
|-- docker-compose.yml
|-- requirements.txt
|-- run.py
|-- venv
`-- webapp
The Dockerfile simply let’s us define how to build the dash app, so we just copy our instructions of how we installed it before. I’m going to include a production grade server as well, green unicorn, but you can use something else if you like. To generate the requirements.txt, you can use pip freeze > requirements.txt from your old virtual env (or just use the one I’ve provided in the repo). With the requirements in hand, our Dockerfile should look something like
FROM python:alpine3.7
LABEL version="1.0" description="a simple personal finance dashboard" maintainer="adkincj@gmail.com"
# adding the C binaries for pandas
RUN apk --update add --no-cache g++
# creating the directory for our code
RUN mkdir -p /app
COPY . /app
WORKDIR /app
# install our requirements for the project with the green unicorn server.
RUN pip install -r requirements.txt gunicorn
# open a port on the container so we can communicate with the app outside of the container.
EXPOSE 8050
# start the dash app with green unicorn (and 2 workers).
CMD ["gunicorn","-w","2","--bind",":8050","webapp:app.server"]
I won’t go into too much detail about how the above works, just accept it does for now. Now let’s add the compose files in. The base docker-compose.yml has the template for our application. It looks something like
version: '3'

services:
  dash:
    image: cjadkins/dash-finance-app
    links:
      - db
      - cache

  db:
    image: postgres:latest

  cache:
    image: redis:latest
which you can see has a reference to the name of our dash image (which we will build), postgres (our relational db we’ll be using) and our caching server redis. For local development (what we’re doing right now) I’ve included an override to add in our local dev settings. So in docker-compose.override.yml we see our local settings
services:
  dash:
    build: . # runs the Dockerfile located in the current directory.
    volumes:
      - .:/app # this binds the current directory to the folder /app in the container
    ports:
      - 8050:8050 # this maps port 8050 on the container to port 8050 on our host.
    environment:
      - FLASK_ENV=development # this is a env var we've added to the container.
    command: ["python", "run.py"] # this is an override of the CMD in the Dockerfile
Here we’re overriding the command in the dockerfile, with the old python run.py we’ve been using to start the server and binding the code on our machine with the code in the container. This means that when we’re changing our code, the code in the container will change as well (even if it’s running). Now we can safely remove our venv and .env (but you can keep them around if you’re more comfortable with them, don’t forgot to add them to your .dockerignore if you keep them around), and start our local dev server with docker-compose up (docker-compose is bundled in docker for windows. If you’re on a Unix system. I’m fairly sure you need to get it separately). Last thing you’ll need to update is the run.py and update the bind:
from webapp import app

if __name__ == '__main__':
    app.run_server(debug=True,host="0.0.0.0",port=8050)
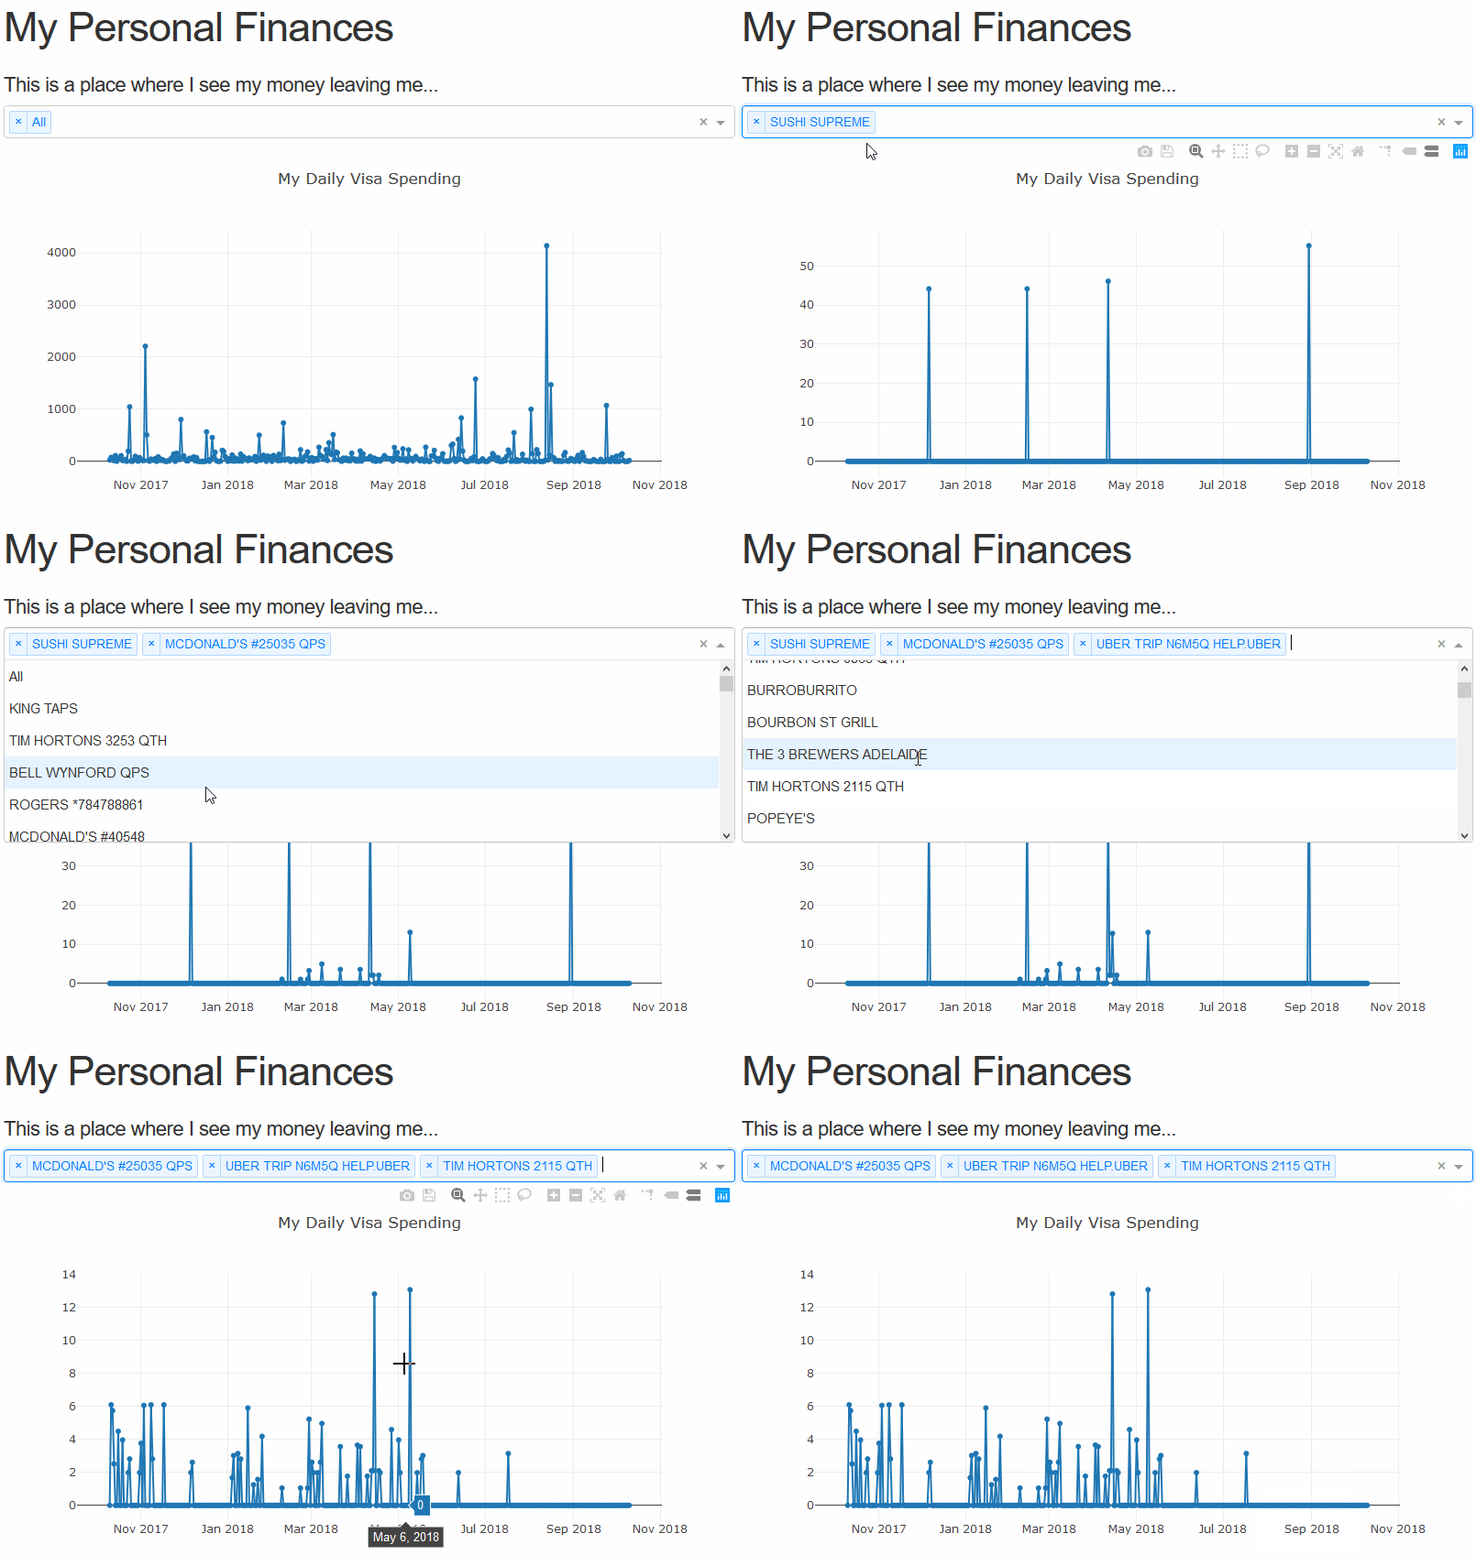
Let’s get back to the app. The next short goal will implement is a selector for the vender, and get that change what our spending is for that vender. I’ve updated my load_data method to add all the my monthly csv files I got from the bank, since we’ll add the db connection piece later. I’ve also added a simple method to place the vender data into a format plotly likes(which follows {'label':'This is shown as an option','value':'this is value of that option'}):
def load_data(self):
    files_path = os.path.join(os.getcwd(),"webapp","test_data")
    all_files = glob.glob(os.path.join(files_path, "*.csv"))
    self.data = pd.concat((pd.read_csv(f,names=DATA_COLUMNS) for f in all_files))
    self.data[DATA_DATE] = pd.to_datetime(self.data[DATA_DATE]).dt.date

...

def get_vendor_options(self):
    vendors = self.data[DATA_VENDOR].unique()
    options = [{'label':'All','value':0}]
    options.extend([{'label':vendors[n],'value':n+1} for n in range(0,len(vendors))])
    return options
This vendor method simply gives us all the selections that will work with the data loaded, so to add the options to dashboard we go to index.py.
def render(x,y,vendor_options=VENDOR_TEST_OPTIONS):
    return html.Div(children=[
        ...

        dcc.Dropdown(
            id=VENDOR_SELECTOR_ID,
            options=vendor_options,
            multi=True,
            value=[vendor_options[0]['value']]
        ),
VENDOR_SELECTOR_ID = 'vendor-selection'
VENDOR_TEST_OPTIONS = [
{'label': 'All', 'value': 0},
{'label': 'Vendor 1', 'value': 1},
{'label': 'Vendor 2', 'value': 2},
{'label': 'Vendor 3', 'value': 3}
]This adds the options to the dashboard, but it currently doesn’t do anything to the page. So let’s add a callback for some action. First we’ll update our data manager with the method to filter for our selection. You’ll see that the values of the dropdown element will always come back as an [int], so we’ll plan for an index match to see what’s included. Also, I realized we aren’t filling null dates at this point, and I think the graph looks better with the 0’s included. So Let’s make the following edits to data.py
def get_charge_series_tuple(self,data=pd.DataFrame()):
    # take the default argument to be the data frame within the manager.
    if data.empty:
        data = self.data
    try:
        series = data.groupby([DATA_DATE]).sum()[DATA_CHARGE]
        index_range = pd.date_range(min(self.data[DATA_DATE]),max(self.data[DATA_DATE]))
        series = series.reindex(index_range,fill_value=0)
        return (series.index,series.values)
    except AttributeError:
        raise Exception(DATA_MANAGER_NO_DATA)
    except KeyError:
        raise Exception(DATA_MANAGER_KEY_ERROR)

...

def get_selected_charge_series_tuple(self,selection = [0]):
    vendors = self.data[DATA_VENDOR].unique()
    selected_vendors = [element for index, element in enumerate(vendors) if index+1 in selection]
    filtered_data = self.data[self.data[DATA_VENDOR].isin(selected_vendors)] if not 0 in selection else self.data
    return self.get_charge_series_tuple(filtered_data)
Now our callback is simple to create, we just have to update the figure we’re showing. So let’s create a file called callback.py and include the one callback:
from dash.dependencies import Input,Output

from webapp import app, dm

from ..consts import VENDOR_SELECTOR_ID,OUTPUT_GRAPH_ID

from webapp.managers.graph import createFigure,createScatterTrace

@app.callback(
    Output(OUTPUT_GRAPH_ID,'figure'),
    [Input(VENDOR_SELECTOR_ID,'value')])
def selector_change(selected_values):
    x, y = dm.get_selected_charge_series_tuple(selected_values)
    return createFigure([createScatterTrace(x,y)])
The syntax here might be a little weird for you, but we’re adding a callback to dash app (app) which will trigger when there’s a change to the property value of the HTML element id=VENDOR_SELECTOR_ID. The name of the function below the attribute isn’t important since the function directly below get’s called. In our case we’re updating the figure property of the HTML element with id=OUTPUT_GRAPH_ID. Lastly we just have to include this callback to the webapp by importing it in the __init__.py file.
...
# load the data
dm = DataManager()
dm.load_data()
x,y = dm.get_charge_series_tuple()
vendor_options = dm.get_vendor_options()

app.layout = index.render(x,y,vendor_options)

from .callbacks import callback
Now let’s have a look at what we have so far. My dashboard is looking something like:

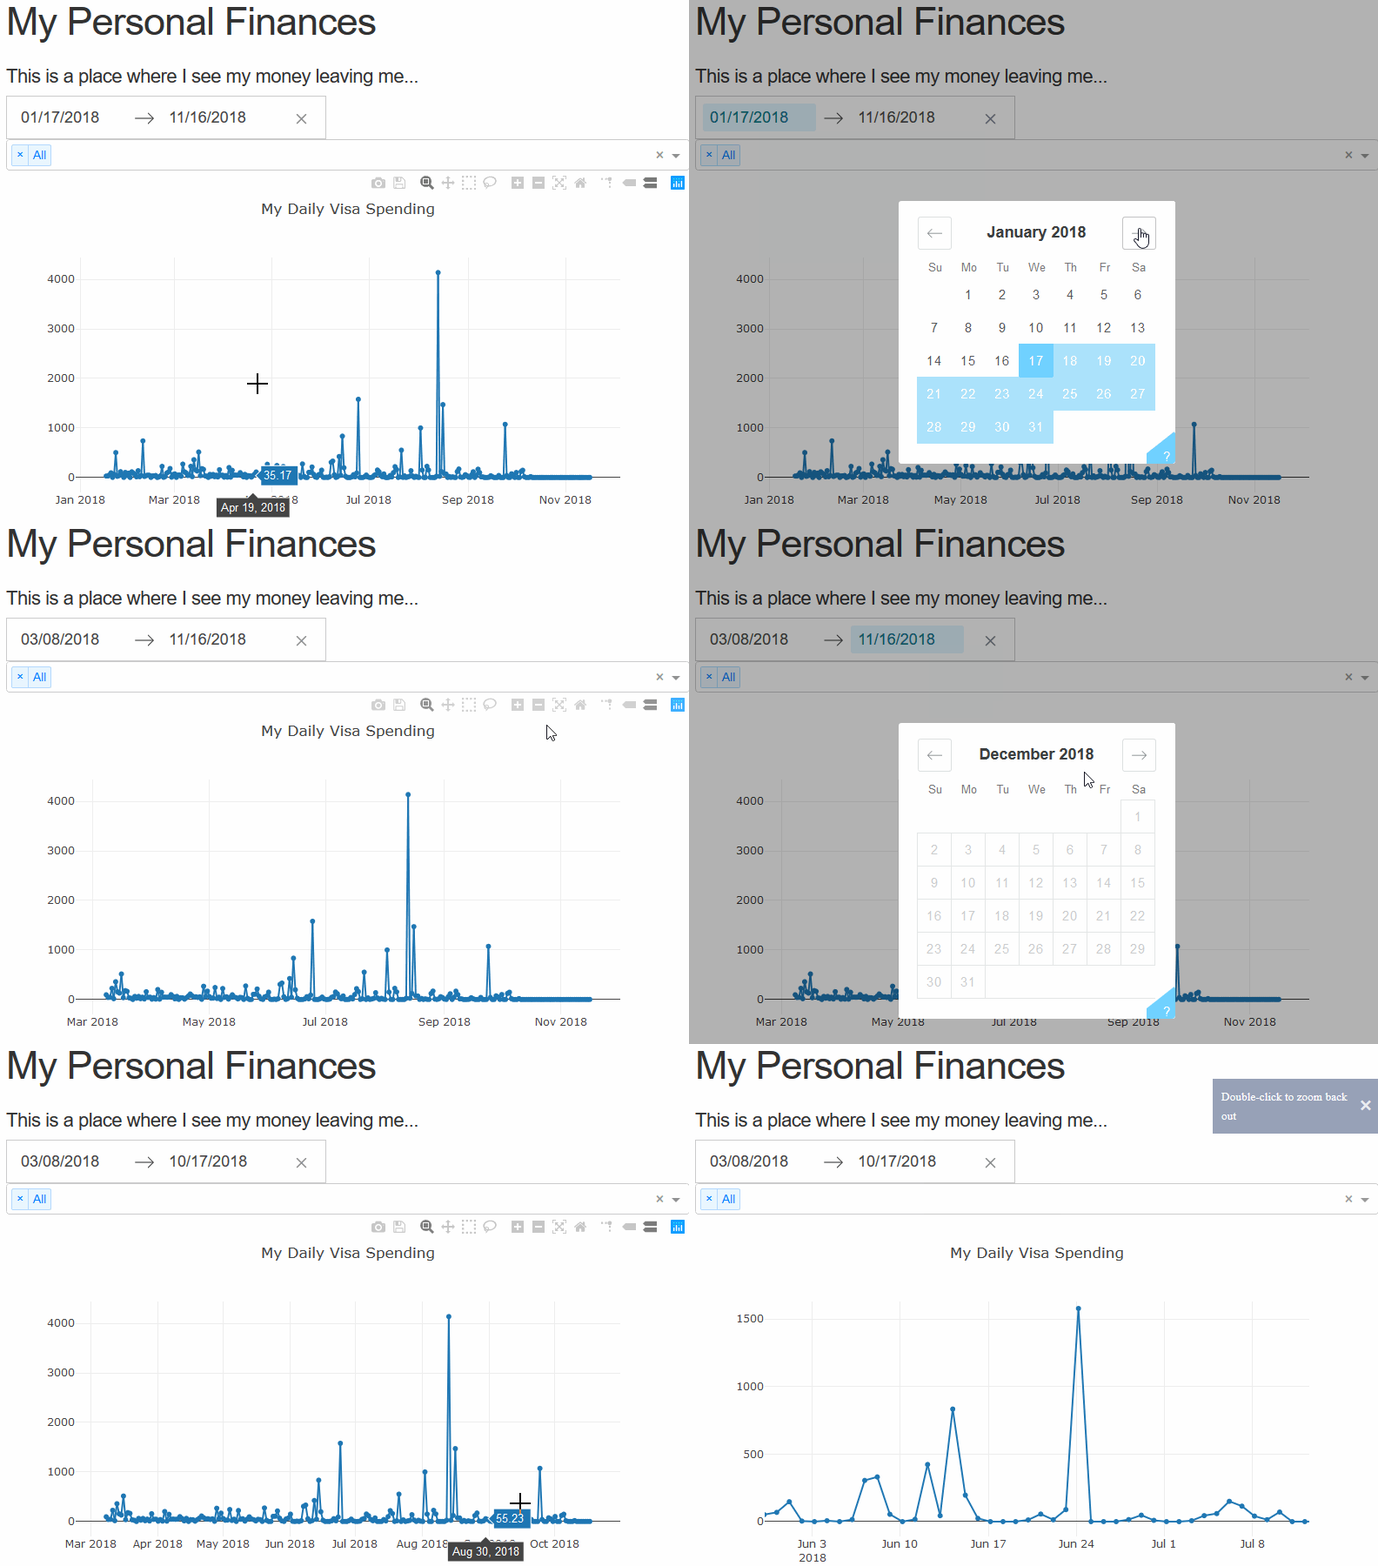
The last thing we’ll add in this tutorial part is another selector for the date, so we may easily change the bounds of the graph. Using the re-indexing trick we used earlier this is a cake walk. We simply need to add the method arguments and the data will bound itself.
def get_charge_series_tuple(self,data=pd.DataFrame(),min_date=None,max_date=None):
    ...
    if min_date == None:
        min_date = min(self.data[DATA_DATE])

    if max_date == None:
        max_date = max(self.data[DATA_DATE])

    try:
        series = data.groupby([DATA_DATE]).sum()[DATA_CHARGE]
        index_range = pd.date_range(min_date,max_date)
...
def get_selected_charge_series_tuple(self,selection = [0],min_date=MIN_DATE_SELECTOR,max_date=MAX_DATE_SELECTOR):
    ...
    return self.get_charge_series_tuple(filtered_data,min_date,max_date)
Next up let’s throw the HTML in with the handy dash component into index.py.
...
dcc.DatePickerRange(
    id=DATE_SELECTOR_ID,
    minimum_nights=7,
    clearable=True,
    with_portal=True,
    min_date_allowed=MIN_DATE_SELECTOR,
    start_date=MIN_DATE_SELECTOR,
    max_date_allowed=MAX_DATE_SELECTOR,
    end_date=MAX_DATE_SELECTOR
),
...
Now we just have to add the callback. Since we’ve updated the method already, we just have to add the inputs to the callback.
@app.callback(
    Output(OUTPUT_GRAPH_ID,'figure'),
    [Input(VENDOR_SELECTOR_ID,'value'),
    Input(DATE_SELECTOR_ID, 'start_date'),Input(DATE_SELECTOR_ID, 'end_date')])
def selector_change(selected_values,min_date,max_date):
    x, y = dm.get_selected_charge_series_tuple(selected_values,min_date,max_date)
    return createFigure([createScatterTrace(x,y)])
That ends of this part of the tutorial, next time we’ll add more views of the data and give ourselves the ability to drill down.
